
Monthly Market Insights – April 2017
Performance Data and Commentary as of 3/31/2017
DOMESTIC EQUITY
•US stocks posted a small gain in March, despite a mid-month pullback as President Trump’s health care bill to replace the Affordable Care Act failed in Congress. This reduced confidence in Trump’s ability to carry out policy initiatives, but the market rebounded as efforts quickly shifted to tax reform.
•Large cap stocks outperformed smaller caps, but the difference in returns narrowed from previous months. Volatility levels remained subdued, with March 21st the only day with a decline of more than 1% during 2017. Dividend stocks were mixed, with real estate hurt by weaker future prospects for mall and retail properties.
•Growth stocks outperformed value, benefiting from strength in the technology and consumer discretionary sectors. Value stocks were weighed down by weakness in the financial sector, amid uncertainty around policy changes. Energy stocks declined on lower oil prices, with increased US production and OPEC supply cuts unlikely to be extended past June.
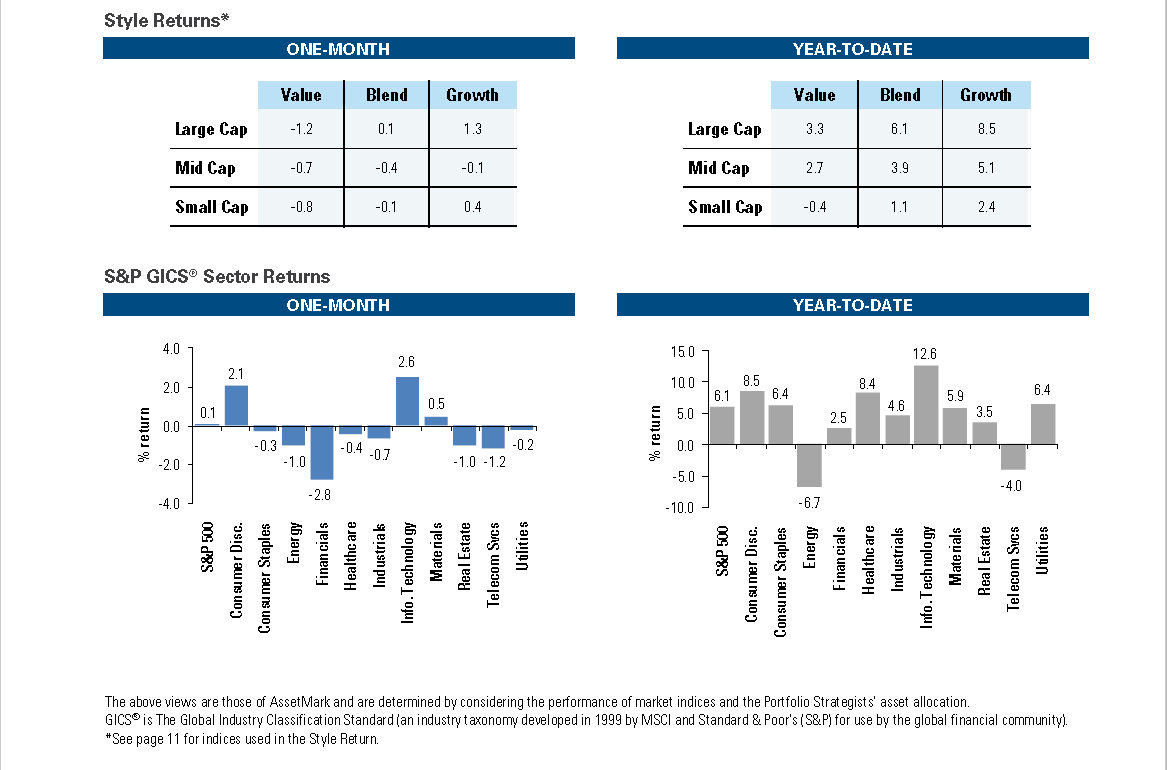
The above views are those of AssetMark and are determined by considering the performance of market indices and the Portfolio Strategists' asset allocation.GICS® is The Global Industry Classification Standard (an industry taxonomy developed in 1999 by MSCI and Standard & Poor's (S&P) for use by the global financial community). *See below for indices used in the Style Return.
INTERNATIONAL EQUITY
• The MSCI EAFE international index outperformed US stocks for the month, with lessened political risk in Europe and improving economic data. International stocks rose 2.5% in local currency terms.
• European stocks benefited as businesses reported better economic conditions, while prospects for Le Pen being elected French President diminished. Britain initiated the process of Brexit, but fears of a broader eurozone breakup eased.
• The Asian region gained with lessened fears surrounding US trade policy. Japan was hurt by weaker data on household spending. Emerging markets were lifted by India, as its governing party was supported in the recent election.
COMMODITIES & CURRENCIES
• Commodities were weighed down by lower agricultural prices, with soybean plantings reaching record levels. Energy prices were mixed as oil prices declined, while natural gas prices rose on lower inventories and expectations for higher summer demand. Gold was down only marginally as the weaker dollar supported foreign demand.
• The US dollar declined versus the broad basket of foreign currencies, amid uncertainty around Trump policy plans. Emerging market currencies benefited on lessened fears over US trade policy – the Mexican peso rose 6.2% for the month.
FIXED INCOME
• The US fixed income market finished modestly down for the month, as the 10-year Treasury yield rose from 2.36% to 2.40%. Long-term bonds saw the larger declines with their greater sensitivity to rates. Credit spreads widened, which hurt corporate bonds including the high yield sector.
• International bonds posted modest gains, lifted by foreign currency gains versus the US dollar. Emerging market bonds benefited from improving prospects for economic growth and their higher yields.
• Equity allocations lifted global portfolios during the month, with better results in the higher risk profiles. Global diversification benefited returns as international equities beat the US market.
*Global Market Index returns use a combination of the MSCI ACWI equity index and Bloomberg Barclays Global Aggregate bond index corresponding to investor risk profile. For example, the Profile 1 index is comprised as follows: 20% MSCI ACWI / 80% Bloomberg Barclays Global Aggregate Index. Allocations are rebalanced on a monthly basis. All index data represents total return including the reinvestment of dividends for the stated period. All returns are obtained from Zephyr StyleAdvisor, except sector returns, which are from Morningstar Direct.
Sector Returns: Sector returns are obtained from Morningstar Direct and reflect the returns of the S&P 500® Sector Indices. The 11 sector indices are classified using the Global Industry Classification Standard (GICS®), a four-tiered industry classification structure.
Style Returns: Style box returns based on S&P Indexes. All values are cumulative total return for stated period, including reinvestment of dividends. The Index used for each box from left to right, top to bottom are:
S&P 500 Value, S&P 500®, S&P 500 Growth
S&P MidCap 400 Value, S&P MidCap 400®, S&P MidCap 400 Growth
S&P SmallCap 600 Value, S&P SmallCap 600®, S&P SmallCap 600 Growth
INTERNATIONAL EQUITY
All indexes except S&P 500 provided by MSCI.
COMMODITIES & CURRENCIES
Commodities are represented by the Bloomberg Commodity Index. Foreign currencies are measured versus the US dollar with returns obtained from Zephyr StyleAdvisor. The US Dollar is represented by the Bloomberg US Dollar Index.
FIXED INCOME
The US Aggregate is the Bloomberg Barclays US Aggregate Bond Index; cash is represented by the Citigroup 3-month T-Bill Index; Short-Term is represented by the Bloomberg Barclays US Treasury 1-3 Year; Long-Term by the Bloomberg Barclays US Treasury Long Index; Governments by the Bloomberg Barclays US Government Intermediate Index; Corporates by the Bloomberg Barclays US Corporate Investment Grade Index; High Yield by the Bloomberg Barclays US Corporate High Yield Index; TIPS by the Bloomberg Barclays US Treasury TIPS Index; Municipals by the Bloomberg Barclays US Municipal Bond Index; International by the Bloomberg Barclays Global Aggregate ex-US Index; Emerging Markets by the Bloomberg Barclays Emerging Markets USD Aggregate Bond Index.
AssetMark, Inc.
1655 Grant Street 10th Floor
Concord, CA 94520-2445 800-664-5345

Opinions and estimates offered constitute our judgment and are subject to change without notice, as are statements of financial market trends, which are based on current market conditions. We believe the information provided here is reliable, but do not warrant its accuracy or completeness. This material has been prepared for informational purposes only. References to future returns are not promises or even estimates of actual returns a client portfolio may achieve. Any forecasts contained herein are for illustrative purposes only and are not to be relied upon as advice or interpreted as a recommendation. It is not possible for one to invest in an index. Past performance does not guarantee future results.

AssetMark, Inc. is an investment adviser registered with the Securities and Exchange Commission. ©2017 AssetMark, Inc. All rights reserved.
6428 | M0000 | 3/2017 | EXP 9/30/17

For use with the general investing public.